Web Inspector is a debugging and profiling developer tool that is included as part of the WebKit browser rendering engine. It is available for BlackBerry developers to use either in the BlackBerry PlayBook browser, or applications created using the BlackBerry WebWorks SDK for Tablet OS.
Here is how you enable Web Inspector for use in a BlackBerry WebWorks application for Tablet OS:
- Use the "-d" command line argument when building your application using the BlackBerry WebWorks SDK for Tablet OS.
Eg. "bbwp c:\sandbox\helloWorld.zip -d"
- Deploy your application to a PlayBook simulator or Tablet.
- Start your application.
- Ensure that developer mode is enabled from the Tablet OS, and make note of the Tablet OS IP address.
- Open a desktop browser and navigate to the URL "http://<IP address>:1337"
Blog article: Debugging BlackBerry web applications using Web Inspector .
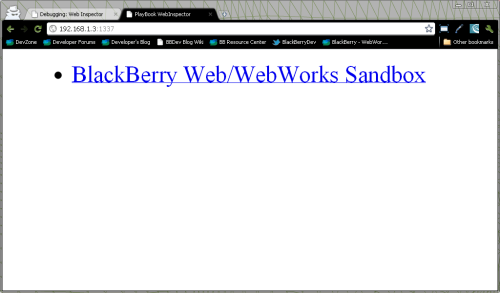
Web Inspector Enabled:
When you first connect to Web Inspector from a desktop browser, you will see a title screen showing the current page loaded in the WebWorks application.
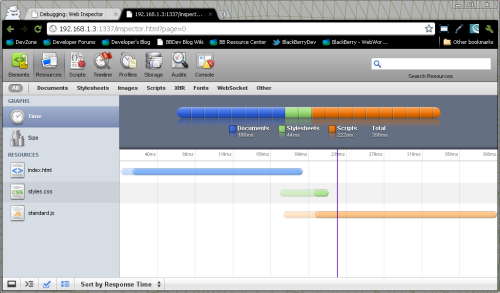
Using Web Inspector:
You can then click on the title, and begin debugging and profiling that page using the variety of developer utilities provided by Web Inspector: